
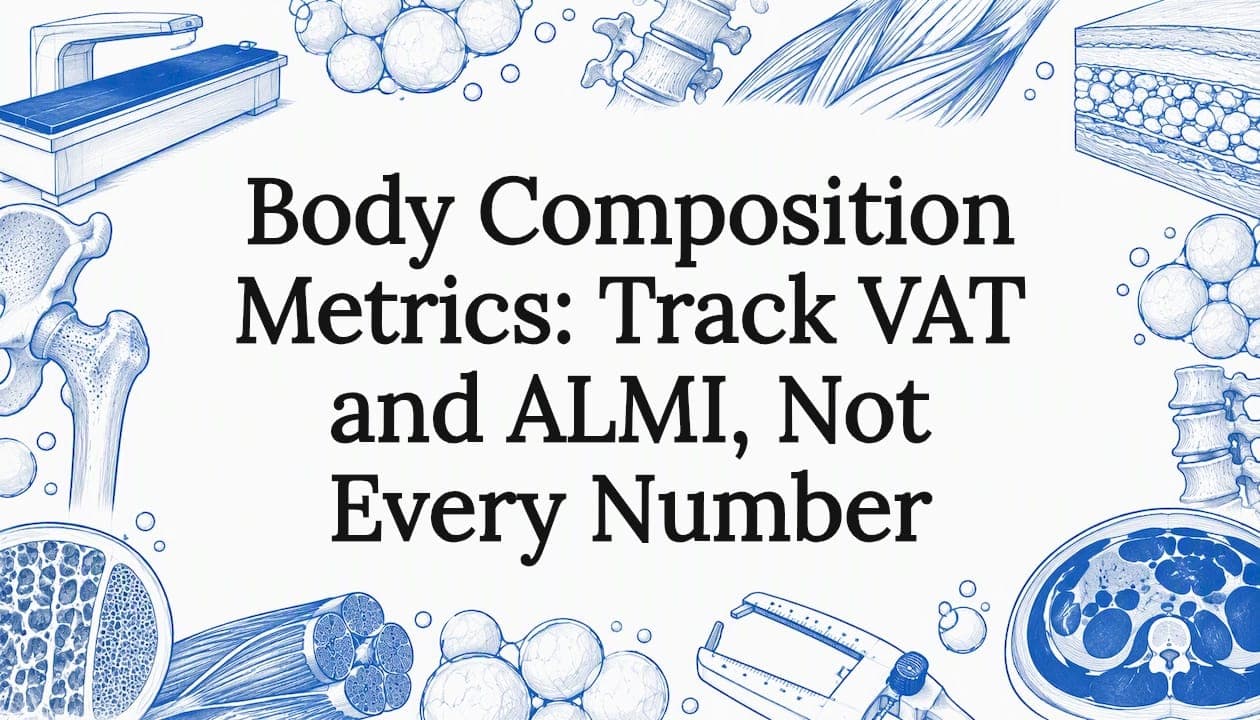
Body composition metrics break your weight into fat, lean tissue, bone, and water, and the ones worth tracking are body fat percentage, lean mass (especially appendicular lean mass index, or ALMI), visceral adipose tissue (VAT), and bone measures. A DXA scan can provide regional data on fat, lean tissue, and bone, making it a useful option when you need those measurements.
TL;DR:
- Choose BIA for home trend tracking only when you use the same device under the same conditions; DXA requires a whole body composition protocol for regional data.
- Published DXA guidance links VAT areas of 100–159 cm² with increased risk and 160 cm² or more with high risk, not diagnoses.
- Body fat percentage varies by age and sex, while ALMI cutoffs vary by guideline; compare personal trends with clinical references, not universal targets.
- For repeat scans, keep hydration, exercise, clothing, timing, and positioning consistent, and use the same machine; small shifts within device error do not prove change.
Table of Contents
- What do fat, lean, bone, and water numbers actually mean?
- How is body composition measured, and how do the methods compare?
- How do you interpret your numbers without over-reading them?
- How do you track composition reliably and avoid noise?
- When should you choose a DXA scan, and what should the report include?
- Which metrics I would build goals around
- Where can you book a whole-body DXA scan?
- FAQ
- Sources
What do fat, lean, bone, and water numbers actually mean?
A body composition report can look like a wall of numbers. Each one answers a different question, and knowing which question helps you avoid chasing the wrong figure.
Fat mass vs. body fat percentage. Total fat mass is reported in kilograms and tells you how much fat you carry in absolute terms. Body fat percentage divides that by total body weight. Fat mass is handy when you want to see whether a diet actually removed fat, because percentage can move simply because muscle changed. Percentage is handy for comparing yourself against ranges. Neither should be read alone: ACSM guidance warns against relying on a single metric like body fat percentage in isolation, since interpretation depends on hydration, muscle distribution, and your goals.
Lean mass and ALMI. Lean mass is everything that is not fat or bone: muscle, organs, and water held in those tissues. Appendicular lean mass (ALM) is the lean tissue in your arms and legs, which is a decent proxy for skeletal muscle. ALMI divides ALM by height squared (kg/m²), so a tall person and a short person can be compared fairly. Clinicians use it to screen for sarcopenia, the age-related loss of muscle. A 2020 review of DXA body composition notes that DXA provides indices such as FMI and ALMI.

Bone: BMC and BMD. Bone mineral content (BMC) is the mass of bone mineral, while bone mineral density (BMD) is that mineral spread over the scanned area. A whole-body DXA reports both alongside fat and lean mass, so you get a composition picture and a bone picture from one scan.
Total body water. Water sits inside lean tissue, so a hydration swing can nudge your lean-mass reading up or down without any real change in muscle. That is why standardizing your pre-scan routine matters so much, a point we return to below.
Derived indices you will see on reports:
- Fat mass index (FMI): fat mass divided by height squared, an adiposity measure that adjusts for body size.
- Lean mass index (LMI): lean mass divided by height squared, the total-body counterpart of ALMI.
- Android/gynoid ratio: fat around the abdomen (android) compared with fat around the hips and thighs (gynoid). A higher ratio points to a more central fat pattern.
- Visceral adipose tissue (VAT): fat packed around the organs deep in the abdomen, estimated by DXA software.
- VAT/SAT ratio: visceral fat relative to subcutaneous fat under the skin, showing how much of your abdominal fat sits deep.
Practitioners value the regional numbers in particular. According to UC Davis Health's DXA resource, regional distribution such as android/gynoid ratio and VAT predicts cardiometabolic risk better than total percent fat. If you want a deeper walk through one of these indices, our guide to the lean mass index covers it.
How is body composition measured, and how do the methods compare?
Several methods exist, and they do not measure the same thing. Picking one is a trade-off between accuracy, cost, and convenience.
The main methods:
- DXA (DEXA): two low-dose X-ray beams separate bone, fat, and lean soft tissue, with regional breakdowns.
- Bioelectrical impedance analysis (BIA): a weak electrical current travels through the body, and resistance is converted into an estimate. Found in at-home scales and clinical devices.
- Skinfold calipers: a trained person pinches and measures skin and fat at set sites, then plugs the numbers into an equation.
- Hydrostatic weighing: you are weighed underwater, and body density is used to estimate fat.
- MRI and CT: cross-sectional imaging that gives precise anatomical volumes, mostly used in research and clinical settings.
Where each one fits. DXA is favored for whole-body and regional measures. The 2020 review cited above explains that DXA distinguishes bone, fat, and lipid-free soft tissue, while MRI and CT remain the gold standards for anatomical volumes. BIA and skinfolds earn their place through convenience and population screening. Anthropometric prediction models built on skinfolds and circumferences can estimate body fat, but a CDC-hosted validation study of body fat prediction models shows they carry larger errors than DXA and often require trained measurement to work well.
What DXA actually does. A whole-body DXA scan measures total and regional BMC/BMD along with lean and fat mass, and the 2024 DXA practice guideline recommends standardized reporting and cross-calibration so results can be compared across devices. There is an important distinction here. A diagnostic spine and hip scan is designed to assess bone density for osteoporosis. A whole-body composition protocol is a different scan that produces the fat and lean outputs. If you want body composition, you need to ask for the whole-body protocol.
VAT estimation. Modern DXA software, such as vendor tools like CoreScan and InnerCore, can estimate visceral adipose tissue from the abdominal region. It is an estimate rather than a direct anatomical measurement, which is why MRI and CT retain the gold-standard label. Still, for tracking change in the same person on the same machine, it is a practical window into deep abdominal fat. Typical report items include total fat mass, percent fat, regional fat, lean mass, and bone outputs.
Comparing them in practice.
- What they measure: DXA, MRI, and CT image tissues directly. BIA infers from electrical resistance. Skinfolds infer from subcutaneous thickness. Hydrostatic weighing infers from density.
- Accuracy: DXA offers detailed regional data. We describe the body-fat precision of a DXA scan as roughly ±1–2%, which is why many people use it as their reference point. Our breakdown of DXA accuracy goes deeper. A patient-focused explainer on what patients should know about DXA accuracy is also a useful read.
- Time and cost: BIA and calipers are quick and cheap. DXA takes a short appointment and costs more. MRI and CT are the most expensive and least available for this purpose.
- Availability: Scales and calipers are everywhere. DXA requires a clinic with the equipment, and MRI or CT requires a hospital or research setting.
If you only want to watch a general trend at home, BIA can do that job, provided you use the same device under the same conditions. If you need regional data you can trust, DXA is the stronger pick.
How do you interpret your numbers without over-reading them?
Numbers only mean something with context. A single value rarely tells you whether you are healthy, and rigid "ideal" targets can mislead.
Body fat percentage. Typical ranges differ by age and sex, so we avoid giving one universal target. Women generally carry more essential fat than men, and body fat tends to creep up with age even when weight stays flat. Compare yourself to age- and sex-appropriate ranges from your clinician, and focus on your own trend.
VAT thresholds. A review of DXA-derived indices describes VAT area of 100–159 cm² as associated with increased cardiometabolic risk and 160 cm² or more as associated with high risk. Treat these as examples from published work rather than diagnoses, since different software and devices can report different values. Our explainer on the visceral fat score range shows how those scores are laid out.
ALMI cutoffs. DXA guidelines reference ALMI cutoffs for flagging low lean mass and screening for sarcopenia. The exact numbers depend on the guideline and population, so ask your provider which reference values their report uses. Clinical experts writing in a paper on DXA-derived adiposity and lean indices recommend incorporating total body DXA into routine management for patients with obesity or sarcopenia, to quantify fat distribution and appendicular lean mass and to track interventions.
Obesity is best viewed through excess adiposity, and staging considers function and comorbidities alongside measured fat. Per CDC-hosted work on staging systems, systems like EOSS weigh functional impairment and other conditions, not just a body fat reading, so a number on a report is never the whole story.
Why FMI can beat BMI. FMI isolates fat relative to height, so it separates adiposity from muscle and bone. BMI cannot do that. Two people with the same BMI can have very different fat mass.
Where BMI still helps. According to the CDC's BMI guidance, BMI is a quick, low-cost screening tool at the population level, but it does not distinguish fat, muscle, or bone. For an individual, consider it alongside medical history, blood pressure, cholesterol, and direct imaging like DXA when available. For a side-by-side look, see our comparison of body fat vs. BMI.
A quick interpretation checklist:
- Read fat, lean, and bone numbers together, not one at a time.
- Prefer your own trend over a population average.
- Treat VAT and ALMI cutoffs as screening signals, not verdicts.
- Bring the report to a clinician who knows your history.
How do you track composition reliably and avoid noise?
The biggest threat to useful tracking is inconsistency. If conditions change between scans, you may read noise as progress or failure.
Steps for repeatable measurements:
- Keep your hydration consistent. Drink and eat roughly as you normally would, and avoid dramatic changes the day before.
- Avoid heavy exercise before the scan, since a hard session may shift fluid and affect readings.
- Wear similar clothing each time, without metal, and show up at a similar time of day.
- Return to the same machine and facility. Comparing results from different machines or manufacturers can produce variation, and the ABRASSO position statement on densitometry body composition recommends follow-up scans on the same machine with consistent positioning.
- Wait long enough between scans. Body composition changes can take time to show up, while bone changes take longer. Our guide to DXA scan timing lays out the intervals.
Common mistakes. Comparing a smart-scale number to a DXA number is the classic one, since the two methods measure different things and will not match. Another is expecting a single scan to be more precise than the device allows. Small changes inside the device's error range are not proof of anything.
Pro Tip: Book your next scan at the same facility, on the same weekday and time, so the only thing that changes between scans is you.
Consistency also pays off when you act on the data. If you are using lean-mass targets to shape your training, a practical full body fitness workflow can help you turn those numbers into a weekly plan.
When should you choose a DXA scan, and what should the report include?
DXA adds the most value when you need regional detail or want bone and composition together. Think tracking regional fat changes, assessing sarcopenia risk, or getting a bone evaluation alongside body composition.
The key is to ask for a whole-body composition protocol, not only a spine and hip bone exam. Without it, you will not get the outputs that matter for tracking.
What a usable report should contain:
- Total fat mass and body fat percentage
- Fat mass index (FMI)
- ALMI and total lean mass
- Visceral adipose tissue (VAT)
- Android/gynoid ratio and regional breakdowns
- BMC and BMD outputs
Booking tips: request the whole-body protocol by name, schedule at a consistent time, and ask which software and manufacturer the provider uses if you plan repeated measures. That last detail lets you stay on comparable equipment next time. For a full explanation of the test itself, see what a DEXA scan is.
Which metrics I would build goals around
My view: start with VAT and ALMI, because they say more about health and performance than a scale or a single body fat percentage ever will. Let DXA-derived indices guide your strength and nutrition targets, then give the process time. Real shifts in composition show up over weeks to months, not days, so judge yourself on the trend.
— Erik
Where can you book a whole-body DXA scan?
You can search verified whole-body DXA locations and book without a referral. Find a whole-body scan near you.
This article is general information, not a substitute for advice from a qualified doctor. Consult a qualified healthcare professional about your own circumstances before acting on anything here.
FAQ
Is 50% skeletal muscle mass good?
It depends on your sex, age, and how skeletal muscle mass is measured, so there is no single pass mark. Different devices and reports calculate it differently, which makes comparing against a generic number unreliable. Ask your provider which reference range their report uses, and track your own trend.
What are the 5 levels of body composition?
Definitions vary. Everyday reports often focus on the body's molecular composition, including fat, lean tissue, bone mineral, and water.
What is a good body composition score?
Scores differ by device and vendor, so a "good" number on one platform may not mean the same on another. Focus on the components that matter, such as body fat percentage, ALMI, and VAT, and compare them against age- and sex-appropriate reference values.
Is 25% body fat chubby?
Whether 25% is high depends on age and sex, since typical ranges differ between men and women and shift over a lifetime. Fat distribution also matters, and ACSM guidance cautions against judging health from one body fat figure alone. A DXA report with VAT and regional data gives a fuller answer.