

Trabecular bone score (TBS) is a unitless index calculated from lumbar spine DXA images that captures information about bone microarchitecture rather than bone quantity. When combined with bone mineral density (BMD) and FRAX, it improves fracture risk prediction, particularly for patients sitting near a treatment decision. TBS is not a stand-alone diagnostic test. It works as a modifier, refining a risk estimate that BMD alone can get wrong.
TL;DR:
- TBS provides additional fracture risk information mainly in patients near treatment thresholds, especially those with conditions like diabetes that mask true risk on BMD alone.
- Results can vary significantly depending on software version, platform, and image quality, requiring careful interpretation and comparison over time.
- A TBS below approximately 1.200 to 1.230 indicates degraded microarchitecture and higher fracture risk, while values above 1.310 suggest normal bone structure.
- TBS is most useful when incorporated into adjusted FRAX scores or modified T-scores, refining clinical decisions without replacing standard BMD testing.
- Accurate TBS assessment depends on knowing the DXA machine platform and software version, and on considering possible confounding factors like spinal degeneration and body composition.
Table of Contents
- What Trabecular Bone Score Measures and How It Differs From Bone Mineral Density
- How TBS Is Computed From a DXA Image
- Clinical Evidence: Does TBS Actually Predict Fractures?
- How Clinicians Apply TBS: Adjusted FRAX and Adjusted T-Scores
- Factors That Affect TBS Accuracy and Interpretation
- Using TBS to Monitor Treatment: What the Guidelines Actually Say
- How to Get a DXA That Supports TBS Reporting
- What Counts as a Normal, Partially Degraded, or Degraded TBS Score
- Limitations and Pitfalls Worth Knowing Before You Rely on TBS
- Dexascans: Find a DXA That Reports Trabecular Bone Score
- Key Guidance Documents Worth Reading
- A Practical Read on Where TBS Actually Helps
- Sources
- FAQ
What Trabecular Bone Score Measures and How It Differs From Bone Mineral Density
BMD tells you how much mineral is packed into bone. Trabecular bone score tells you something BMD cannot: how that bone is structurally arranged. TBS analyzes the pixel gray-level variations in a lumbar spine DXA image, using them as an indirect marker of trabecular number, spacing, and connectivity. Dense, tightly connected trabecular struts produce one texture pattern on the image. Sparse, disconnected struts produce another, even when the total mineral content looks identical on a density scan.
That distinction matters in a specific, recurring clinical situation: a patient with normal or only mildly low BMD who still breaks a bone. This happens often enough that researchers built a name for it. A patient can have a T-score that reads as osteopenic, borderline, or even normal, while the underlying scaffolding of the vertebra is degraded and fracture prone. TBS catches that gap. Bone density testing measures the amount of material in the wall. TBS estimates whether the studs behind that wall are still holding it up.
This is not a hypothetical distinction. In people with type 2 diabetes, BMD frequently sits in the normal range while TBS is reduced, a pattern that helps explain why these patients fracture more often than their bone density scores predict. That single fact is a big part of why TBS earned a place in clinical guidelines instead of staying a research curiosity.
TBS adds the most useful information in a few recurring scenarios:
- Patients whose FRAX score or BMD sits close to a pharmacologic treatment threshold, where a small adjustment changes the recommendation.
- Patients with conditions known to mask true fracture risk on density scans alone, including type 2 diabetes and some causes of secondary osteoporosis.
- Patients being reassessed after an unexpected fracture despite reassuring bone density numbers.
Outside those situations, TBS still gets calculated on a compatible scan, but it changes the clinical picture far less.
How TBS Is Computed From a DXA Image
TBS is generated through post-processing software applied to the same lumbar spine image already captured during a standard DXA exam. No extra radiation, no separate appointment. The algorithm builds a variogram, essentially a map of how gray-level values differ between pixels at increasing distances across the image. It then takes the slope of the log transformed variogram to produce a single unitless number for the L1 through L4 vertebrae.
The practical steps look like this:
- The DXA technologist acquires a standard lumbar spine scan, following the same positioning used for BMD.
- TBS software (commonly TBS iNsight) analyzes the region of interest, calculating gray-level texture across L1 to L4.
- Vertebrae with visible fracture deformity, severe degenerative overlap, or hardware artifact get excluded from the average, the same exclusion logic used for BMD reporting.
- The software outputs a TBS value alongside the standard T-score and Z-score on the DXA report.
Image quality and platform compatibility both affect the result. Not every DXA machine runs TBS software, and results between Hologic and GE platforms are not always directly interchangeable without proper calibration. Software version matters too. Older TBS algorithms used body mass index as a proxy to correct for soft tissue attenuation around the spine, and that proxy introduced bias in patients with higher central adiposity. Newer versions instead use measured tissue thickness captured directly from the scan, which reduces that bias substantially.
Pro Tip: If you are comparing TBS results from two different scans taken years apart, ask whether both were processed with the same software version. A jump in your number might reflect a software upgrade, not a real change in bone quality.
Clinical Evidence: Does TBS Actually Predict Fractures?
Yes, and the evidence is not thin. Multiple systematic reviews and large population cohorts, including the Manitoba bone density registry, show that TBS predicts vertebral, hip, and major osteoporotic fractures independently of BMD. That independence is the entire point. A tool that just re-measured density in a different way would add nothing. TBS tracks a separate biological signal.
The size of the effect is not trivial. Per standard deviation declines in lumbar spine TBS are commonly associated with roughly 30 to 40 percent higher fracture risk in postmenopausal cohorts, an effect size that holds up even after adjusting for BMD and standard clinical risk factors. That is a meaningful jump in risk for a measurement that requires no additional scan, no extra radiation, and no added appointment time.
Guideline bodies have caught up to the data. The ESCEO/IOF working group recommends integrating TBS with BMD and FRAX specifically to sharpen fracture risk assessment, and the 2023 ISCD Official Positions go further, stating that TBS is most likely to change clinical management in patients aged 40 and older who sit near a pharmacologic intervention threshold.
What does "changes management" mean in practice? A few concrete situations:
- A postmenopausal woman with osteopenia whose FRAX score falls just under the treatment threshold. A degraded TBS value can push the adjusted probability over that line.
- A patient with type 2 diabetes and reassuring BMD numbers whose low TBS flags a fracture risk the density scan alone would have missed.
- A patient near the boundary between watchful monitoring and starting therapy, where TBS functions as the deciding factor rather than the only factor.
None of this makes TBS a replacement for BMD or FRAX. It is a refinement layered on top of tools that already work reasonably well, sharpening the picture at exactly the point where clinical decisions are hardest to make.
How Clinicians Apply TBS: Adjusted FRAX and Adjusted T-Scores
There are two established ways to fold TBS into a fracture risk conversation, and clinicians tend to pick whichever their reporting software supports.
- TBS-adjusted FRAX. The clinician enters the standard FRAX inputs, including femoral neck BMD, then applies a TBS-based adjustment factor derived from the L1 to L4 value. The output is an adjusted 10-year probability of major osteoporotic and hip fracture, which is what actually gets compared against national treatment thresholds.
- Adjusted BMD T-score. When FRAX is not practical or not locally validated, some clinicians use an alternative approach: adjusting the lowest measured BMD T-score based on the degree of TBS degradation. This produces a modified T-score that better reflects true fracture risk without requiring a full FRAX calculation.
Here is where this matters in a real encounter. Picture a 62-year-old woman with osteopenia, a femoral neck T-score of negative 1.8, and a FRAX-calculated 10-year major fracture probability just under her country's intervention threshold. Standard practice would be to monitor and rescan in a couple of years. If her lumbar TBS comes back degraded, the TBS-adjusted FRAX probability can cross that threshold, changing the conversation from "monitor" to "consider starting therapy now." That is not a subtle shift. It is the difference between watching and treating, and it happens without a single additional test.
Clinicians using this approach still weigh it against the full clinical picture: family history, prior fracture, glucocorticoid use, and the bone density test results already on file. TBS refines the estimate. It does not override clinical judgment.
Factors That Affect TBS Accuracy and Interpretation
TBS is sensitive to a handful of technical and biological variables that can shift the number without any real change in bone quality.
- Body composition. Older TBS algorithms leaned on BMI as a stand-in for soft tissue thickness around the spine, which introduced measurable bias in patients with higher central adiposity. Software using directly measured tissue thickness corrects much of that bias.
- Degenerative spinal disease. Osteoarthritis, disc space narrowing, and facet joint overlap can distort the texture pattern the algorithm reads, often inflating TBS artificially.
- Compression fractures and surgical hardware. Vertebrae with visible fracture deformity or metal hardware get excluded from the TBS average, following the same exclusion rules used for standard BMD reporting.
- Population and validation range differences. Reference ranges were built from specific cohorts, and applying them across very different populations introduces uncertainty.
- Inter-software variability. Results from different manufacturers or software versions are not always perfectly interchangeable, even when the same patient is scanned twice.
Pro Tip: Always check whether prior spinal surgery, compression fractures, or severe arthritis affected which vertebrae were included in your TBS calculation. A result based on only two vertebrae instead of four carries more uncertainty than the report might suggest.
No universally accepted correction exists for every one of these variables, which is exactly why TBS gets read alongside BMD and clinical context rather than in isolation.
Using TBS to Monitor Treatment: What the Guidelines Actually Say
Some osteoporosis therapies do move TBS. Anabolic agents and denosumab show measurable TBS improvement in some studies, while bisphosphonates tend to preserve existing TBS values more than dramatically raising them. That sounds like a useful monitoring tool in the making. It is not quite there yet.
Current ISCD guidance advises against routine TBS-based monitoring for most patients, because the magnitude of meaningful change has not been standardized the way it has for BMD, and the correlation between a TBS shift and actual fracture reduction remains weaker than the correlation for BMD change. Clinics that do track serial TBS should treat trends as supporting information, read together with BMD and clinical outcomes, never as a stand-alone signal that therapy is or is not working. Score-shopping across scans, chasing small TBS fluctuations without context, is a documented concern among practitioners for good reason.
How to Get a DXA That Supports TBS Reporting
Not every DXA machine outputs a TBS value, so a little preparation before booking saves a repeat visit.
- Call ahead and ask whether the facility's DXA software includes TBS analysis (commonly TBS iNsight) and which version they run.
- Ask whether their machine is Hologic or GE, since TBS compatibility and calibration differ by platform.
- Bring copies of prior DXA reports, and mention any spinal surgery, known compression fractures, or hardware, since those affect which vertebrae get included.
- Follow standard DXA prep: avoid calcium supplements the morning of the scan, skip any recent barium studies, and wear clothing without metal.
Because TBS is a post-processing calculation, it can often be pulled from previously stored lumbar images without a new scan, if the facility kept the raw image data and runs compatible software. Worth asking about before scheduling a scan you might not need. Dexascans lists verified DXA locations across the country where you can check equipment details and cash pricing before you book, without needing a physician referral in states that allow direct access.
What Counts as a Normal, Partially Degraded, or Degraded TBS Score
Reports typically sort TBS values into three interpretive bands: normal microarchitecture, partially degraded microarchitecture, and degraded microarchitecture. Different studies and manufacturers have proposed different numeric boundaries for these bands, commonly landing somewhere in the range of 1.200 to 1.350, with some analyses using tertile cutoffs around 1.230 and 1.310. No single cutoff has been universally adopted across every population and software platform.
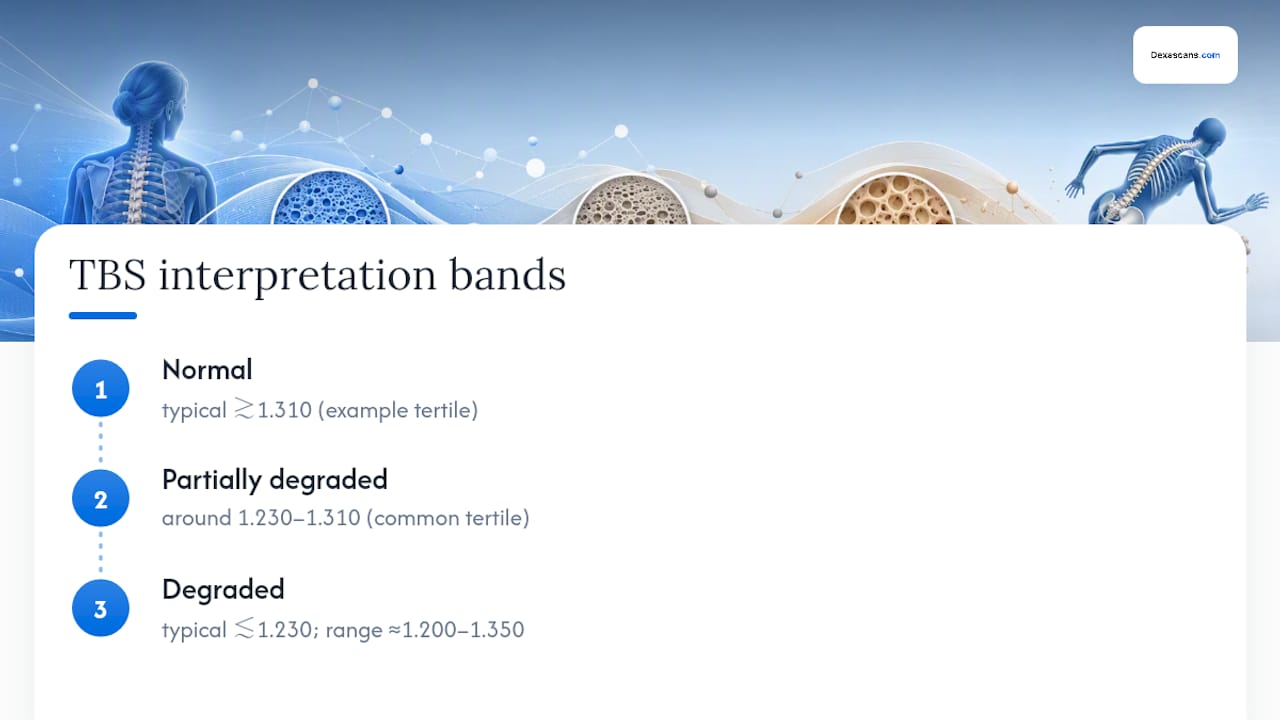
That variability is not a flaw to shrug off. It means the same raw TBS number could land in "normal" on one report and "partially degraded" on another, depending on which reference thresholds the software applies. A degraded score does not, by itself, confirm a diagnosis of osteoporosis, and a normal score does not rule out elevated fracture risk if BMD or clinical history says otherwise.
The practical takeaway for anyone reading their own report: treat the category label as a starting point for a conversation, not a verdict. Ask which threshold set the report used, and ask how that category interacts with your actual BMD and FRAX numbers. The three-tier system is genuinely useful for flagging risk quickly. It just was not built to be read alone.
Limitations and Pitfalls Worth Knowing Before You Rely on TBS
TBS has real, well-documented limits. Results are not perfectly interchangeable across different DXA machines and software versions, which means a TBS value from one clinic's Hologic system and another clinic's GE system may not track cleanly against each other over time. A software upgrade partway through a monitoring period can shift baseline numbers in ways that have nothing to do with a patient's actual bone health, a point worth flagging any time serial results get compared.
Body composition remains an imperfect variable even with newer tissue-thickness corrections, and patients at the extremes of body size may still see less reliable results than average-weight patients. Degenerative spine disease is common in the exact age group getting scanned for osteoporosis risk, and it can distort the texture pattern the algorithm depends on. Vertebral exclusion rules help, but they also mean some reports are built from fewer usable vertebrae than others, quietly reducing precision without always being obvious on the printed report.
Perhaps the biggest pitfall is treating TBS as a diagnostic test on its own. It was never designed for that. It works as a refinement layered onto BMD and FRAX, useful mainly at the margins where a treatment decision is genuinely close. Outside that zone, it adds information without necessarily changing what a clinician recommends.
Dexascans: Find a DXA That Reports Trabecular Bone Score
There are other routes to getting bone density testing: a referral through a primary care office, a hospital imaging department, or whatever facility happens to be closest. All of them work, but none of them tell you upfront whether the machine actually runs TBS software or what a scan will cost you out of pocket.
There are many verified DXA locations across the country where you can search by city or ZIP code to see which clinics offer bone density testing, what they charge in transparent cash pricing, and whether a physician referral is required in your state. That transparency matters, since cash prices at independent imaging centers can be significantly lower than typical hospital rates for the same scan. Check the bone density test page for a breakdown of what a scan typically costs and what a T-score report includes, or go straight to the locations search to compare clinics near you and book an appointment directly.
Key Guidance Documents Worth Reading
For readers who want the primary literature rather than a summary, three sources anchor most of the clinical guidance on TBS: the 2023 ISCD Official Positions, the ESCEO/IOF working group update, and the broader PMC review on trabecular bone score covering mechanism and cohort evidence.
A Practical Read on Where TBS Actually Helps
The biggest misconception about trabecular bone score is that it is either a breakthrough diagnostic or a gimmick, when the honest answer sits in between. TBS earns its place because it resolves genuine uncertainty at the exact moment a clinician has to decide whether to treat. It does not earn a place as a routine monitoring tool, and I think the profession is right to hold that line until the evidence for standardized change thresholds catches up.
What gets underestimated is how much software version and platform compatibility matter to the number on the page. Patients fixate on the single value. The more useful question is whether that value was generated the same way as any prior scan they are comparing it to.
Discuss any TBS result with a clinician who understands both your BMD and your broader risk profile. Dexascans exists to make the logistics of that process simpler by helping you find a facility that reports TBS in the first place, compare pricing, and book without unnecessary delay.
— Erik
This article is general information, not a substitute for advice from a qualified doctor. Consult a qualified healthcare professional about your own circumstances before acting on anything here.
FAQ
What is a normal trabecular bone score?
Normal microarchitecture is commonly reported somewhere above the 1.310 to 1.350 range, though exact cutoffs vary by manufacturer and study, and no single universal threshold applies across all populations.
What is the average T-score for a 70-year-old woman?
Average T-scores decline with age and vary by population, but many women in their seventies fall in the osteopenic range on standard DXA; a clinician should interpret your specific T-score alongside TBS and FRAX rather than against a generic average.
What is a bad TBS score?
A degraded TBS score, often cited below roughly 1.200 to 1.230 depending on the reference range used, indicates disrupted trabecular microarchitecture and is associated with meaningfully higher fracture risk independent of BMD.
Is trabecular bone score the same as T-score?
No. T-score measures bone mineral density, essentially how much mineral is present, while TBS measures the texture pattern of that bone, an indirect marker of microarchitecture; the two are read together, not interchangeably.