
FRAX estimates your 10-year probability of having a hip fracture or a major osteoporotic fracture, using clinical risk factors alone or combined with femoral neck bone density. It was developed from multiple international cohort studies and gives clinicians a number, not just a category, to work with. In the United States, a 10-year hip fracture probability around 3% or higher, or a major osteoporotic fracture probability around 20% or higher, commonly triggers a conversation about treatment.
TL;DR:
- FRAX provides more accurate fracture risk estimates than T-scores alone, especially when combined with clinical risk factors and femoral neck bone density.
- A 10-year hip fracture risk above 3% or major osteoporotic fracture risk above 20% generally signals the need for treatment consideration in the US.
- The tool is most reliable with recent DXA measurements and accurate input of variables such as prior fractures, family history, and medication use.
- FRAX results should be interpreted within the broader context of individual health, including T-scores, fracture history, and patient preferences.
- Limited factors like falls, race, and ethnicity calibration can influence the accuracy, requiring clinicians to consider these limitations.
Table of Contents
- What FRAX measures and why clinicians use it
- How FRAX is calculated: inputs, BMD, and model basics
- Interpreting FRAX results: thresholds and clinical use
- Who should use FRAX and when to calculate it
- Limitations and controversies: what FRAX misses
- How to get your FRAX score: a step-by-step approach
- Practical perspective: using FRAX in shared decision making
- Dexascans: an option to obtain the DXA data FRAX needs
- Sources
- FAQ
What FRAX measures and why clinicians use it
FRAX produces two separate numbers: your 10-year probability of hip fracture and your 10-year probability of a major osteoporotic fracture, a category that includes the hip, spine, wrist, and shoulder. Both come from the same calculation, but clinicians look at them differently because a hip fracture carries a much higher risk of disability and death than a wrist fracture.
For years, bone density testing relied almost entirely on the T-score, a number that compares your bone density to that of a healthy young adult. The problem is that a T-score alone doesn't tell you much about your actual odds of breaking a bone over the next decade. Two people with the same T-score can have very different fracture risks depending on age, fracture history, and other factors. FRAX solves that by translating bone density and clinical history into an absolute probability, which is a more useful number for deciding whether to treat.
FRAX doesn't replace dual-energy X-ray absorptiometry (DXA), the scan that measures bone density. It works alongside it. The tool can run with or without a femoral neck bone density value, but the official FRAX calculator performs best when that number is included.
A few things to keep in mind about how FRAX fits into the bigger picture:
- FRAX gives you a probability, not a diagnosis: it tells you your estimated risk, not whether you have osteoporosis.
- The tool accounts for competing mortality risk, meaning it adjusts for the fact that older adults have other causes of death that compete with fracture risk.
- FRAX results are country-calibrated, so the same risk factors produce different probabilities depending on which population model is used.
Clinicians use FRAX because a single BMD reading, even a very low one, misses a lot of people who go on to fracture. Combining clinical risk factors with bone density catches more of them.
How FRAX is calculated: inputs, BMD, and model basics
FRAX runs on a defined set of clinical risk factors, plus an optional bone density value. Getting an accurate score depends on entering each of these correctly.
The standard inputs are:
- Age, entered as a specific number between 40 and 90.
- Sex, since fracture risk and calibration differ between men and women.
- Weight and height, used together to calculate body mass index.
- Prior fragility fracture, meaning any fracture that occurred from a low-impact fall or minor trauma after age 40.
- Parent hip fracture, a family history question specifically about a parent's hip.
- Current smoking status.
- Glucocorticoid use, meaning oral steroid medication taken for three months or more at a dose equivalent to 5 milligrams or more of prednisolone daily.
- Rheumatoid arthritis diagnosis.
- Secondary osteoporosis, a checkbox for conditions known to cause bone loss independent of other risk factors.
- Alcohol intake, specifically three or more units per day.
- Femoral neck bone mineral density, entered in grams per square centimeter (g/cm2) or as a T-score, if available.
The femoral neck is the preferred BMD input because it's the site FRAX was built and validated around. Entering the value in g/cm2 along with the scanner make gives a more precise result than entering a T-score alone, since T-scores are calculated relative to a reference population and that reference can vary slightly between DXA machines and manufacturers, according to FRAX's own calculation guidance. If you don't have a DXA report, FRAX can still run without BMD, but the estimate is less precise.
The FRAX model also builds in competing mortality risk and uses country-specific calibration, since fracture rates and life expectancy vary by population. That's part of why the Sheffield FRAX tool asks you to select a country model before you enter your other data. Choosing the wrong country model can meaningfully skew your result.
Pro Tip: Round your weight and height honestly rather than estimating, and double check whether a past fracture was truly low-trauma (a car accident doesn't count, but a fall from standing height does) before you answer that question.

Interpreting FRAX results: thresholds and clinical use
Once you have your two numbers, hip fracture probability and major osteoporotic fracture probability, the next question is what they mean for treatment. In the United States, the commonly used intervention thresholds are a 10-year hip fracture probability of 3% or higher, or a 10-year major osteoporotic fracture probability of 20% or higher, according to BHOF clinician guidance.
A FRAX score at or above 3% for hip fracture, or 20% for major osteoporotic fracture, is commonly used as the point at which pharmacologic treatment is considered for postmenopausal women and men aged 50 and older with low bone mass, according to BHOF guidance. These aren't arbitrary cutoffs. They came out of cost-effectiveness analyses that weighed the price of generic bisphosphonate therapy against the cost of untreated fractures, using a willingness-to-pay threshold near $60,000 per quality-adjusted life year.
Clinicians don't use these thresholds in isolation. A FRAX score sits alongside:
- Your T-score from DXA, since a very low T-score (typically negative 2.5 or below) often means treatment is appropriate regardless of the FRAX number.
- Any history of fragility fracture, especially a spine or hip fracture, which can push a clinician toward treatment even with a borderline FRAX score.
- Other findings from your exam and history that FRAX doesn't capture on its own, such as recent falls or frailty.
The thresholds also aren't a strict yes-or-no switch. Clinicians and patients are meant to use the score as one input into a broader conversation, not as a verdict that removes judgment from the decision. Shared decision making matters most when a score sits close to a threshold, where personal preferences about medication, side effects, and monitoring can reasonably tip the decision either way.
Who should use FRAX and when to calculate it
FRAX is built for postmenopausal women and men aged 50 and older, particularly those who already show signs of low bone mass or carry other risk factors for fracture. It generally isn't validated for younger adults or for premenopausal women, since the underlying cohort data didn't include those groups.
Several specific scenarios call for calculating a FRAX score:
- A DXA scan shows osteopenia, a bone density level between normal and osteoporosis, and the clinician needs to decide whether treatment is warranted.
- You've had a prior fragility fracture, which changes how the rest of your risk factors should be weighed.
- No DXA scan is available yet, and FRAX without BMD helps decide whether one is worth getting.
- You're a woman approaching or past menopause with risk factors like a parent's hip fracture or long-term steroid use.
The USPSTF evidence review supports BMD screening for women aged 65 and older, and recommends using a clinical risk assessment tool like FRAX for younger postmenopausal women to help decide whether BMD testing is worthwhile in the first place. That review also notes FRAX is the most extensively studied fracture risk tool available, which is part of why it shows up so consistently in BHOF guidance as the default choice.
Limitations and controversies: what FRAX misses
FRAX is useful, but it isn't complete. A few gaps are worth knowing before you treat the number as final.
- Falls aren't in the model. FRAX doesn't ask about recent falls, balance problems, or frailty, even though falling is one of the most direct causes of fracture in older adults.
- The underlying model parameters aren't fully public, which means outside researchers can't independently audit exactly how each risk factor is weighted, according to evidence review documentation.
- Input quality drives output quality. A guessed weight, an unclear fracture history, or a T-score from a different reference population can shift your result more than people expect.
- Thresholds reflect economic assumptions, not universal biology. The hip 3% and major osteoporotic fracture 20% cutoffs came from U.S. cost-effectiveness modeling, so other countries with different drug prices or health systems use different numbers entirely.
Race and ethnicity calibration is the most debated limitation. The United States version of FRAX includes race-specific models, and evidence review analysis raises open questions about how well those models perform for people of mixed race or for immigrants whose background doesn't map cleanly onto the available categories. The USPSTF review echoes this concern, noting that country-specific and race-specific calibration adds real value in some contexts but complicates interpretation in others, and that clinicians need to read scores in context rather than at face value for these patients.
Pro Tip: If your background doesn't fit neatly into one of the available race categories, ask your clinician how that choice might be shifting your score, and weigh the result alongside your T-score and fracture history rather than the FRAX number alone.
How to get your FRAX score: a step-by-step approach
Getting a FRAX score doesn't require special access. Here's how most people go through it.
- Start with the official calculator or your clinician's office. The Sheffield FRAX site is free and public, and many DXA reports already include a calculated FRAX score alongside the T-score.
- Gather your information before you start. You'll want your accurate current height and weight, a clear history of any prior fragility fractures, your current medications (especially long-term steroids), and family history of hip fracture.
- Bring your femoral neck BMD if you've had a DXA scan. The number, in g/cm2, is usually on your DXA report, and using it gives a more precise result than skipping BMD entirely.
- If you haven't had a DXA scan, decide whether you need one first. A DXA scan measures femoral neck bone density directly, which is the single input that most improves FRAX accuracy, and you can locate a nearby testing location if your clinician hasn't already ordered one.
- Review the result with a clinician rather than in isolation. A number without context, especially one near a treatment threshold, is best interpreted alongside your full history.
Practical perspective: using FRAX in shared decision making
FRAX works best as a conversation starter, not a final answer. The score tells you a probability, but it says nothing about how you personally weigh the risk of a fracture against the risk of a medication's side effects, or how much monitoring and follow-up you're willing to commit to. Two people with identical scores can reasonably make different decisions.
The clearest use case is when a score lands close to a threshold, hip risk near 3% or major osteoporotic risk near 20%. That's exactly where clinical judgment and patient preference should carry the most weight, not less. Pairing FRAX with a current DXA scan, and repeating the calculation after a major health change such as a new fracture, a new steroid prescription, or menopause, keeps the number current instead of stale.
— Erik
Dexascans: an option to obtain the DXA data FRAX needs
A FRAX score without femoral neck bone density is a reasonable starting point, but it's a rougher estimate than one built on an actual scan. If you don't already have a recent DXA report, Dexascans is a marketplace built specifically for finding that scan without jumping through a referral first.
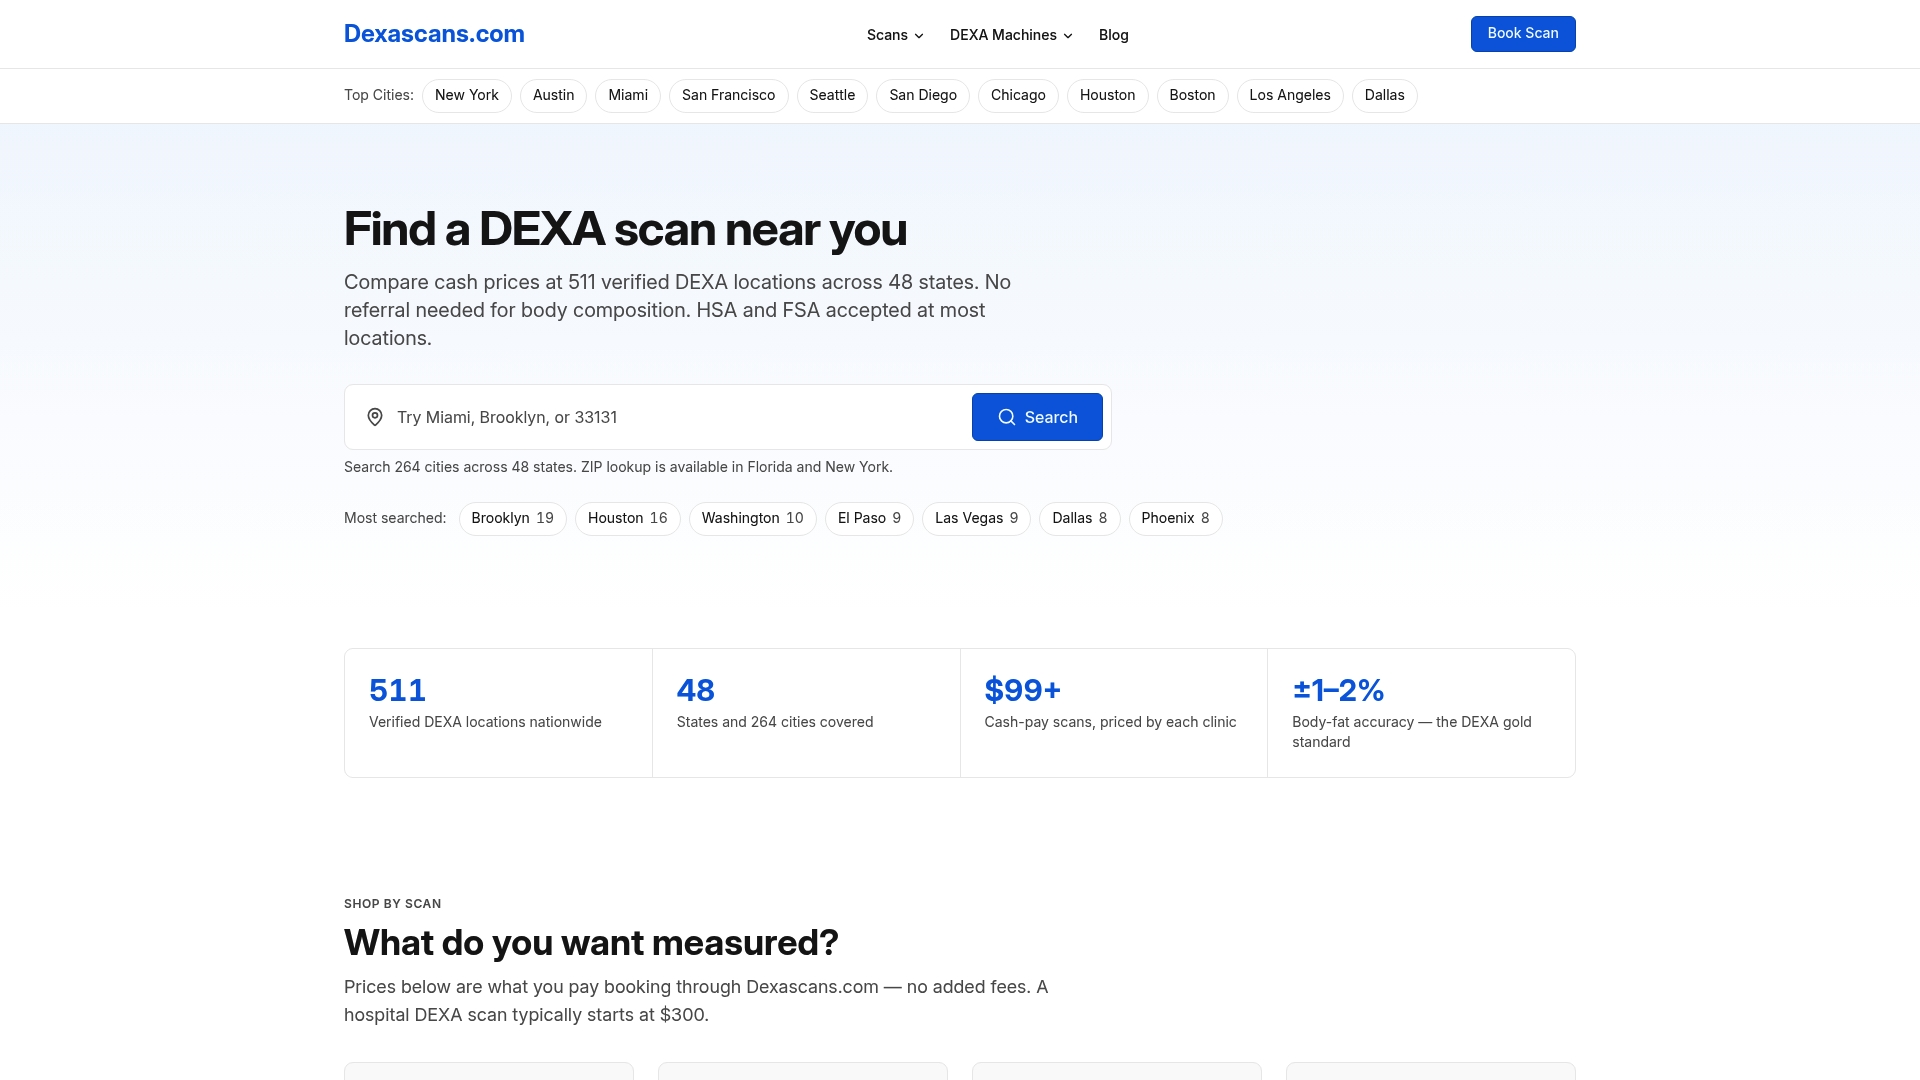
There are online platforms that list DXA locations across many states, some offering transparent cash pricing shown upfront instead of hidden in hospital billing codes. Users can search by city or ZIP code, compare clinic prices, and book appointments directly.
- Search and compare cash prices at DXA clinics near you without needing a doctor's referral first.
- Confirm the clinic offers a bone density scan, since some locations may offer only body composition scans.
- Book appointments directly once you've found a location and price that work for you.
A femoral neck BMD reading from an actual scan gives FRAX a real number to work with instead of an estimate built on risk factors alone. If you're ready to get that number, you can find a bone density testing location near you and bring the results straight into your next FRAX calculation.
Sources
A short list worth bookmarking if you want to go deeper than this article:
- An overview of the use of the fracture risk assessment tool (FRAX) in osteoporosis
- FRAX online calculator (Sheffield)
- Screening for Osteoporosis to Prevent Fractures: Evidence Review (USPSTF)
This article is general information, not a substitute for advice from a qualified doctor. Consult a qualified healthcare professional about your own circumstances before acting on anything here.
FAQ
What is considered a bad FRAX score?
There's no single universal cutoff, but in the United States a 10-year hip fracture probability of 3% or higher, or a major osteoporotic fracture probability of 20% or higher, is commonly treated as the point where pharmacologic therapy is considered, according to BHOF guidance. Scores below these levels aren't necessarily low risk, they just fall below the threshold where treatment is typically recommended on FRAX alone.
At what FRAX score do you treat for osteoporosis?
Treatment is commonly considered when the 10-year hip fracture probability reaches 3% or the major osteoporotic fracture probability reaches 20%, per BHOF clinician guidance. These thresholds are used alongside T-scores and fracture history rather than as a standalone rule, and a clinician may recommend treatment below these numbers if other risk factors are strong.
What's the worst score for osteoporosis?
FRAX doesn't produce a single combined score, so there isn't one worst number. The tool generates two separate probabilities, for hip fracture and for major osteoporotic fracture, and both trend toward higher risk as they approach 100%, though scores that high are uncommon in practice.
What does the 10-year FRAX score estimate?
FRAX estimates your probability of experiencing a hip fracture or a major osteoporotic fracture within the next 10 years, based on clinical risk factors with or without femoral neck bone density, according to research on the tool's development. It gives two separate numbers rather than a single combined score, one for hip fracture and one for the broader major osteoporotic fracture category.