
Peak bone mass typically forms between your late teens and early 30s, with the hip reaching its high point earlier than the spine. Loss is slow and steady through most adulthood, then speeds up for several years after menopause in women and more gradually in older men. If you are past 65, postmenopausal with risk factors, or have had a fragility fracture, talk to your clinician about a DXA scan.
TL;DR:
- Bone reaches its peak in the late teens to early 30s, with the femoral neck typically peaking around ages 19 to 21 and the lumbar spine later.
- Women experience accelerated bone loss during menopause, while men lose bone more gradually, with age and lifestyle factors influencing the rate.
- DXA scans are the standard measurement tool, with results expressed as T-scores and Z-scores; machine consistency and prior reports are vital for accurate monitoring.
- Peak bone density varies by sex, skeletal site, and ethnicity, with non-Hispanic Black adults generally having higher average densities across all age groups.
- Bone loss is driven mainly by hormonal changes, age-related factors, and lifestyle choices such as smoking, alcohol, and physical activity levels.
Table of Contents
- How bone density changes across your lifespan
- How doctors measure bone density and what the numbers mean
- What typical bone density values look like by sex and site
- Why bones lose density as you age
- When to get a bone density test
- Ways to protect bone density at every life stage
- Making sense of your T-score and what comes next
- Bone diseases beyond osteoporosis that affect density
- Where bone density measurement is headed next
- What I'd actually prioritize if I were reading this
- Finding and booking a DEXA scan when you need one
- Sources
- FAQ
How bone density changes across your lifespan
Bone is living tissue, constantly being broken down and rebuilt. During childhood and puberty, formation outpaces breakdown by a wide margin, and this is when most skeletal mass gets laid down. The growth spurt in early adolescence is the single biggest contributor to lifetime bone mass, which is why nutrition and activity during those years matter so much.
After puberty, the timeline splits by skeletal site. A pooled analysis of NHANES data found that femoral neck bone mineral density often peaks around ages 19 to 21, while the lumbar spine tends to peak somewhat later, with the exact timing varying by sex and ethnicity. After that, most adults experience a plateau lasting roughly a decade before density starts drifting downward.
The next major shift hits women at menopause, when a multi-year window of accelerated loss begins. Men see a more gradual decline that picks up pace later in life, often compounded by other health conditions.
- Childhood and puberty: rapid bone accrual, the foundation for lifetime skeletal mass.
- Late teens to early 30s: peak bone mass reached, timing varies by site and sex.
- Early to mid-adulthood: a plateau phase with minimal net change.
- Perimenopause through the following several years: accelerated loss in women.
- Later adulthood: continued gradual decline in both sexes, with rising fracture risk.
| Life stage | Approximate age range | What typically happens |
|---|---|---|
| Childhood growth | Birth to puberty | Steady bone formation, low density relative to adult values |
| Puberty and adolescence | Roughly 10 to 20 | Fastest bone accrual of the lifespan |
| Peak bone mass | Late teens to early 30s | Femoral neck peaks earlier, lumbar spine peaks later |
| Plateau | Early to mid-30s | Formation and breakdown roughly balanced |
| Accelerated loss (women) | Perimenopause through several years post-menopause | Estrogen decline drives faster bone loss |
| Later adulthood | 65 and older | Continued gradual loss, higher fracture risk in both sexes |
How doctors measure bone density and what the numbers mean
The clinical gold standard is dual-energy X-ray absorptiometry, or DXA, which measures bone mineral density at the lumbar spine, femoral neck, and total hip. A low-dose X-ray beam passes through bone and soft tissue, and the machine calculates density from how much radiation is absorbed at each site. According to a clinical overview of DXA interpretation, this method remains the primary tool guidelines recommend for diagnosis and fracture-risk prediction.
Your results come back as two different scores, and mixing them up is a common source of confusion:
- T-score compares your bone density to that of a healthy young adult of the same sex, and it is the number used to diagnose osteopenia or osteoporosis.
- Z-score compares you to others your own age, sex, and body size, and it is more useful for spotting unusual bone loss in younger patients or identifying a secondary cause.
Machine calibration is not a footnote. Different DXA machines, or even the same machine after a software update, can produce slightly different readings for the same person. That is why tracking change over time works best when scans are done on the same machine, or when a facility documents proper cross-calibration between machines.
Pro Tip: Bring your prior DXA report, including the scan date and the machine or facility used, to every follow-up appointment so your clinician can judge whether a change in your T-score reflects real bone loss or just machine variation.
For a step-by-step walkthrough of what the appointment itself involves, a patient-oriented explanation of the DXA procedure covers positioning, scan time, and what the technician is looking for.
What typical bone density values look like by sex and site
Average bone mineral density is not a single number. It depends heavily on which bone is measured, the person's sex, and their ethnic background, which is part of why clinicians lean on T-scores rather than raw density values when making diagnoses.
The NHANES pooled analysis found that femoral neck density generally peaks earliest, around ages 19 to 21, while lumbar spine density peaks a bit later and shows more variation between men and women. Some analyses also point to a secondary peak period for women extending into their mid-30s at certain sites. Men tend to reach peak bone mass slightly later than women and often show higher mean density at some skeletal sites. The same pooled data also found that non-Hispanic Black groups have higher average bone mineral density than other groups measured, a pattern that holds across multiple age brackets.
Non-Hispanic Black adults show higher average bone mineral density than other groups across the age range studied, according to the NHANES pooled analysis, which is one reason a single universal "normal" density value does not exist.
| Skeletal site | Approximate peak timing | Notable pattern |
|---|---|---|
| Femoral neck | Ages 19 to 21 | Often the earliest site to peak |
| Lumbar spine | Later than femoral neck, into the late 20s or 30s | More variation by sex and ethnicity |
| Total hip | Similar window to femoral neck | Commonly used for long-term fracture-risk tracking |
Because absolute density numbers shift so much by site, sex, and ethnicity, clinicians convert raw values into T-scores before making a diagnosis. That standardization is what lets a 55-year-old woman's spine scan and a 70-year-old man's hip scan both get interpreted against the same diagnostic thresholds.
Why bones lose density as you age
The biggest single driver of accelerated bone loss in women is the drop in estrogen that comes with menopause. Estrogen normally helps regulate the cells that break down old bone, and when levels fall, that process speeds up faster than new bone can be built. The National Institute on Aging describes this as a period of markedly faster loss in women, in contrast to the slower, later decline typical in men.
Beyond sex hormones, several other factors raise the odds of faster bone loss regardless of age:
- Advancing age itself, independent of any other condition.
- A prior fragility fracture, which signals existing bone weakness.
- Low body mass index, since less mechanical loading on bone can mean less density.
- Smoking and heavy alcohol use, both linked to lower bone formation.
- Long-term glucocorticoid use, which suppresses new bone formation.
- Chronic inflammatory diseases such as rheumatoid arthritis or inflammatory bowel disease.
Sarcopenia, the age-related loss of muscle mass and strength, compounds the problem in a different way. Even someone with moderately low bone density faces a much higher real-world fracture risk if weak muscles and poor balance make falls more likely. Fracture prevention in older age is rarely about bone density alone.
When to get a bone density test
The U.S. Preventive Services Task Force recommends routine osteoporosis screening for women aged 65 and older, and for younger postmenopausal women whose estimated fracture risk matches that of a typical 65-year-old. The Task Force does not issue the same blanket recommendation for men, concluding that screening decisions for men should be individualized based on personal risk factors.
Several situations call for testing earlier than these general guidelines suggest:
- A fragility fracture, meaning a break from a fall at standing height or less.
- Long-term glucocorticoid therapy for any condition.
- A known secondary cause of bone loss, such as hyperthyroidism or certain malabsorption disorders.
- Strong family history combined with other risk factors.
How often to repeat a DXA scan is not one-size-fits-all. Longitudinal data summarized by the Endocrine Society shows that many older women with a normal baseline T-score, or only mild osteopenia, progress to osteoporosis slowly enough that long intervals between scans are reasonable. Someone with more advanced osteopenia, or someone just starting bone-targeted therapy, typically needs closer monitoring.
Ways to protect bone density at every life stage
What helps your bones depends on where you are in the timeline. Building peak mass in your 20s looks different from preserving it in your 50s.
- Get adequate dietary calcium and vitamin D for your age group, and talk to a clinician about supplementation if your diet falls short.
- Eat enough protein, since it supports the structural matrix bone is built on.
- Do weight-bearing exercise such as walking, jogging, or stair climbing several times a week.
- Add progressive resistance training, since loading bone under increasing weight is one of the more effective ways to stimulate new bone formation.
- Quit smoking and limit alcohol, both of which independently worsen bone loss.
- Reduce fall risk at home through better lighting, non-slip surfaces, and vision checks.
Pro Tip: Combining resistance training with weight-bearing cardio tends to address more of the skeleton than either alone, since different exercises load different bones.
When lifestyle measures are not enough, clinicians may consider pharmacologic therapy. That decision usually factors in a FRAX fracture-risk estimate alongside the DXA result, rather than the T-score in isolation. Treating secondary causes, such as a vitamin D deficiency or an overactive thyroid, often comes before or alongside any bone-specific medication.
Making sense of your T-score and what comes next
A T-score of -1.0 or higher is considered normal. A score between -1.0 and -2.5 indicates low bone mass, often called osteopenia. A score of -2.5 or lower meets the diagnostic threshold for osteoporosis in postmenopausal women and men over 50, according to the Bone Health & Osteoporosis Foundation.
T-score is not the only path to a diagnosis. A fragility fracture after age 50 can be treated as clinical evidence of osteoporosis even if the T-score itself falls short of -2.5.
- Normal (T-score -1.0 or higher): routine prevention, repeat testing per individualized risk.
- Osteopenia (T-score -1.0 to -2.5): closer monitoring, lifestyle measures, risk calculation.
- Osteoporosis (T-score -2.5 or lower, or a fragility fracture): treatment discussion alongside FRAX risk estimate.
FRAX combines your T-score with other inputs, such as age, prior fracture, and glucocorticoid use, to estimate your 10-year probability of a major fracture. Clinicians use that combined picture, not the T-score alone, to decide whether medication is warranted. Monitoring afterward works best on the same DXA machine, or with documented cross-calibration if you switch facilities, since small inter-machine differences can otherwise look like real biological change.
Bone diseases beyond osteoporosis that affect density
Osteoporosis gets most of the attention, but it is not the only condition that lowers bone density or weakens bone structure. Osteomalacia is a softening of bone caused by inadequate mineralization, most often tied to a severe vitamin D deficiency, and it can produce a low-density reading on a scan that actually reflects a mineralization problem rather than classic bone loss. Correcting the underlying deficiency is central to treatment, which is part of why clinicians investigate vitamin D status when a scan result looks unusual for a patient's age.
Paget's disease of bone causes areas of bone to be broken down and rebuilt abnormally fast, leading to bone that is enlarged, weakened, and more prone to deformity or fracture in the affected regions rather than throughout the whole skeleton. It tends to show up on imaging as patchy, irregular density rather than the uniform decline typical of age-related osteoporosis.
Other conditions, including certain inherited disorders and some cancers that affect bone, can also alter density readings. The common thread is that a low T-score is a starting point for investigation, not an automatic osteoporosis diagnosis, especially when the pattern or the patient's age does not fit the typical profile.
Where bone density measurement is headed next
DXA remains the standard, but it is not the only technology being refined. Quantitative computed tomography can assess bone in three dimensions and separate cortical from trabecular bone, offering detail that a standard DXA scan does not capture, though it typically involves a higher radiation dose and higher cost. Peripheral quantitative CT, used at the wrist or lower leg, is being explored as a more accessible option for some screening scenarios.

Trabecular bone score, calculated from existing spine DXA images, is gaining use as a way to estimate bone microarchitecture quality rather than just density, which may help explain why some people fracture at T-scores that look only mildly low. Artificial intelligence tools are also being tested to help automate measurement site selection and improve consistency between machines and technicians, a direct answer to the calibration concerns that currently complicate tracking change over time.
None of these approaches currently replaces DXA as the primary screening tool, but they point toward a future where fracture risk is assessed with more than a single density number.
What I'd actually prioritize if I were reading this
If you take one thing from all of this, make it the risk check. A T-score tells you where you stand today, but your risk factors tell you where you are headed, and that second piece gets ignored far too often in favor of chasing a single number.
My practical checklist: review your personal risk factors honestly, including family history, smoking, and any long-term medication use. Discuss a DXA scan with a clinician if you meet screening criteria or have a flag that warrants earlier testing. Build bone-friendly habits, calcium, vitamin D, resistance training, now rather than after a diagnosis. Then bring your results back to a clinician who can put the number in context, instead of reading it in isolation.
— Erik
Finding and booking a DEXA scan when you need one
If your clinician recommends a DXA scan, or you simply want a baseline before symptoms ever show up, Dexascans lists verified DEXA locations with transparent cash pricing, so you can compare clinics and book directly without a physician referral.
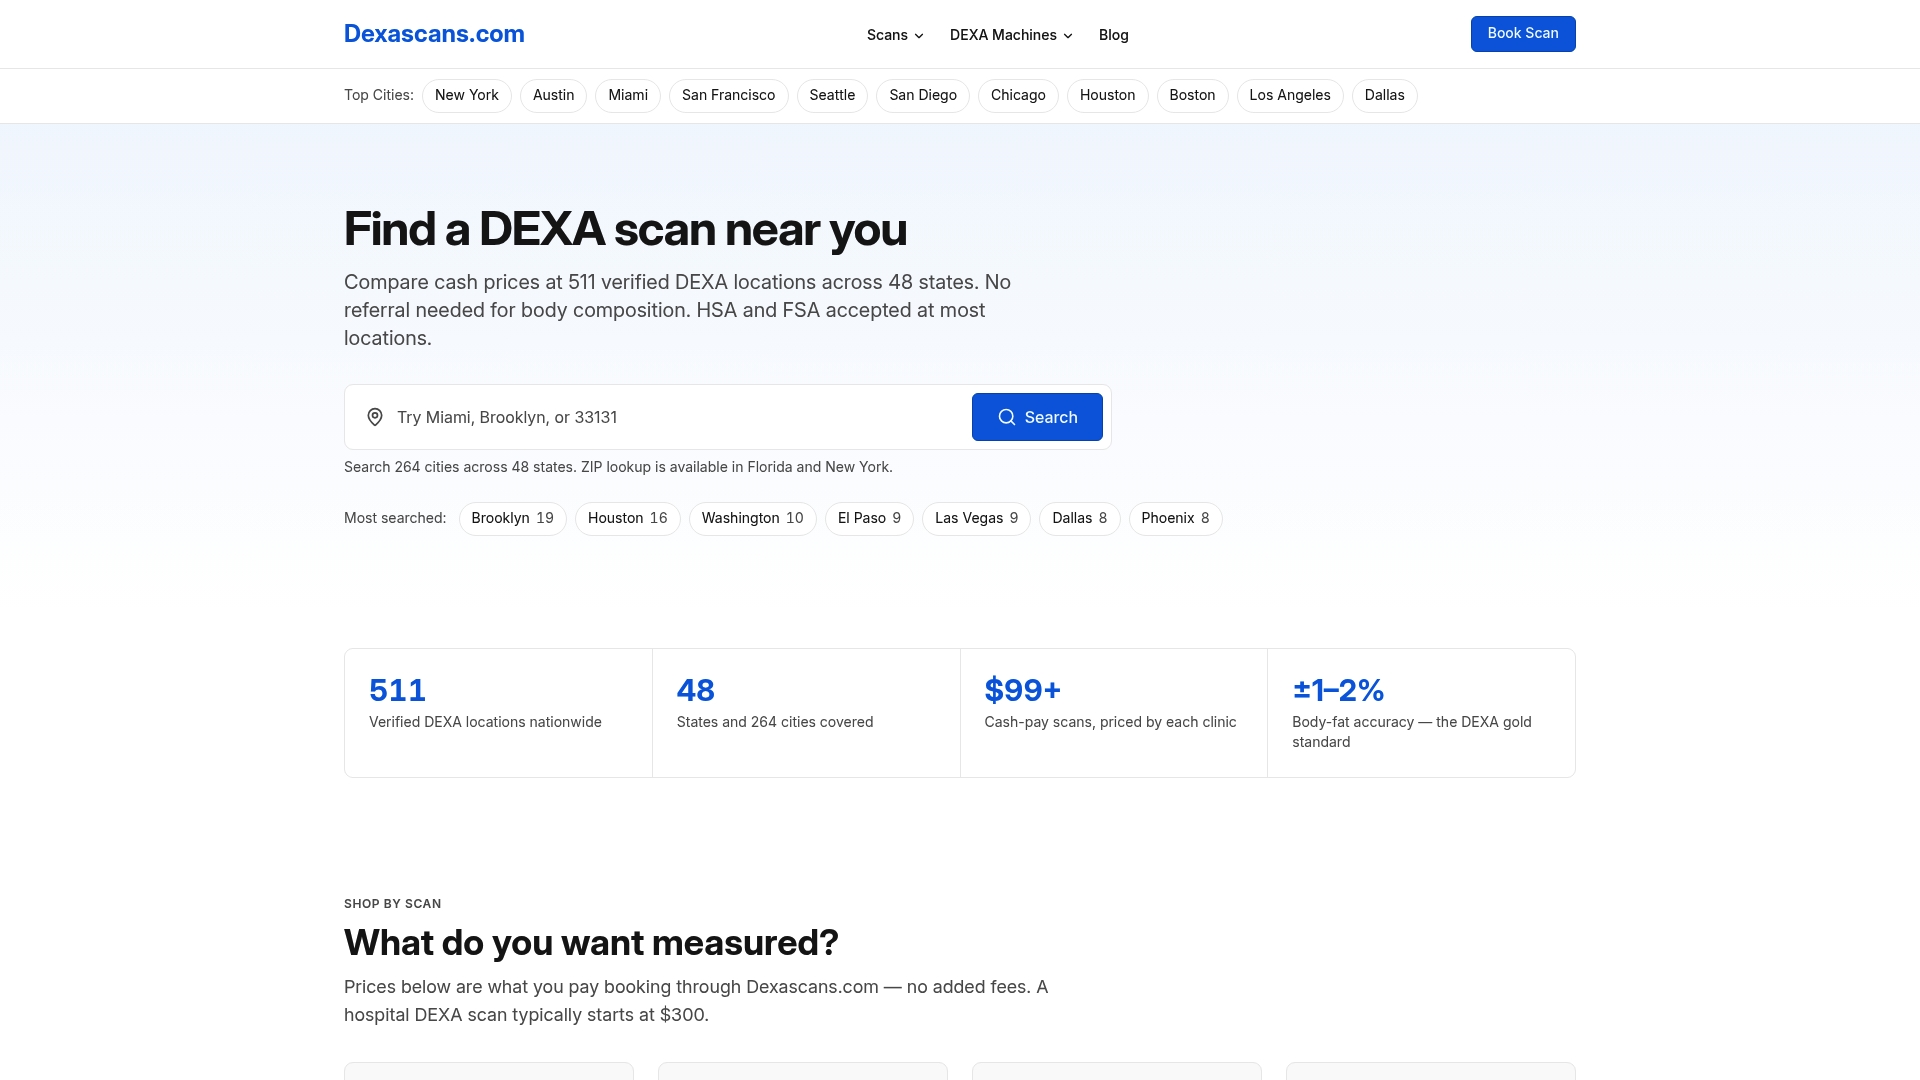
Search by city or ZIP on the DEXA scan locations page to compare nearby clinics and pricing, book the appointment that fits your schedule, and take the printed results to your clinician for interpretation and next steps.
Sources
- U.S. Preventive Services Task Force: Osteoporosis Screening recommendation
- Pooled NHANES analysis of BMD across ages (2024)
- Clinical overview of DXA and BMD interpretation — NCBI Bookshelf
This article is general information, not a substitute for advice from a qualified doctor. Consult a qualified healthcare professional about your own circumstances before acting on anything here.
FAQ
What is the average bone density score for a 70-year-old woman?
There is no single average figure that applies to every 70-year-old woman, since bone density varies by skeletal site and individual risk factors. Many women in this age range fall into the osteopenia range, with a T-score between -1.0 and -2.5, though a large portion also test within the normal or osteoporosis ranges depending on their personal history, as described by the Bone Health & Osteoporosis Foundation.
Can you increase bone density as you age?
Yes, though gains are typically modest compared to the rapid bone-building years of adolescence. Weight-bearing exercise, progressive resistance training, adequate calcium and vitamin D intake, and, when indicated, prescription bone-building medication can help slow loss or produce measurable improvement in density over time.
What are bad numbers for bone density?
A T-score of -2.5 or lower meets the diagnostic threshold for osteoporosis in postmenopausal women and men over 50, according to the Bone Health & Osteoporosis Foundation. A score between -1.0 and -2.5 indicates osteopenia, a lower-risk but still worth-monitoring category, and a fragility fracture after age 50 can itself be treated as evidence of osteoporosis regardless of the T-score.
What is the top vitamin to rebuild bone density?
Vitamin D is the vitamin most closely tied to bone density, since it is essential for absorbing the calcium that bone formation depends on. No single vitamin rebuilds bone on its own, and adequate intake works best alongside sufficient calcium, protein, and weight-bearing or resistance exercise rather than as a standalone fix.