

The android-to-gynoid (A/G) ratio from a DXA scan measures abdominal fat against hip and thigh fat. A value near or above roughly 0.8 for women and 1.0 for men signals fat is concentrated centrally rather than in the hips and thighs, and that pattern tracks with higher cardiometabolic risk even when body weight looks normal. Exact cutoffs vary by lab and software, but the direction of the finding is consistent: more fat up top, more strain on blood pressure, lipids, and blood sugar.
TL;DR:
- An android to gynoid ratio above 0.8 in women or 1.0 in men indicates higher central fat, which is linked to increased cardiometabolic risk even without weight gain.
- Variations in scan region boundaries, software versions, and machine types can affect the ratio, making consistent tracking on the same device more reliable than cross-comparing different clinics.
- The ratio serves as a directional signal, with elevated values suggesting the need for lifestyle adjustments and closer monitoring of blood pressure, lipids, and glucose levels.
- Higher A/G ratios correlate with unfavorable changes in HDL, blood pressure, triglycerides, and increased cardiovascular risk, especially in postmenopausal women.
- Lifestyle changes such as reducing refined carbs, resistance training, high-intensity cardio, and managing stress can gradually lower the ratio over several months.
Table of Contents
- How DXA Calculates the Android Gynoid Ratio
- What Counts as a Low, Borderline, or High Android Gynoid Ratio
- The Evidence Linking a Higher A/G Ratio to Cardiometabolic Risk
- How Sex, Age, and Menopause Shift the Android Gynoid Ratio
- Bringing Your A/G Ratio to a Clinician: What to Pair It With
- A/G Ratio vs. BMI, Waist–Hip Ratio, and Direct VAT Imaging
- Lowering a High A/G Ratio: What Actually Moves the Needle
- Getting an Accurate Scan: Precision, Radiation, and What to Check Before Booking
- Why We Publish A/G Ratio Guides
- Compare Clinics, Machines, and Prices Before You Book
- Sources
- FAQ
How DXA Calculates the Android Gynoid Ratio
A DXA scan does not guess where your fat sits. It draws two boxes on the body composition image and measures the tissue inside each one. The android region covers the abdomen, roughly from just above the hip bones (iliac crest) up to about 20% of the distance to the neck. The gynoid region sits lower, spanning the hips and upper thighs. Everything inside those boundaries gets sorted into fat mass, lean mass, and bone mineral content by the scanner's software.
The android to gynoid ratio itself is simple division: android fat mass divided by gynoid fat mass, or sometimes android fat percentage divided by gynoid fat percentage depending on which report format your clinic uses. There's no unit attached. It's a ratio, not a weight or a percentage, which is part of why it confuses people the first time they see it on a printout. A ratio of about 1.0 indicates the two regions carry roughly equal fat mass, with higher values reflecting relatively more abdominal fat.
Here's where it gets a little messier. The exact region boundaries aren't universal across manufacturers.
- Hologic and GE Lunar, the two dominant DXA platforms in U.S. clinics, use slightly different default placements for the android box, which can shift the ratio by a meaningful margin between machines.
- Software versions matter too. An older enCORE or APEX software build may draw the android region differently than the current release, even on the same machine.
- Some scans are limited to certain regions rather than a true full-body composition scan, which can produce an A/G ratio that isn't directly comparable to a full-body result.
- Positioning errors, like slight rotation of the pelvis or incomplete inclusion of the abdomen in the scan field, introduce measurement drift that has nothing to do with your actual body fat.
None of this makes the number useless. It just means the A/G ratio from one clinic should be compared cautiously against a scan from a different machine or a different software version. If you're tracking your own trend over time, the most reliable approach is repeating scans on the same DXA machine brand, ideally at the same clinic.
What Counts as a Low, Borderline, or High Android Gynoid Ratio
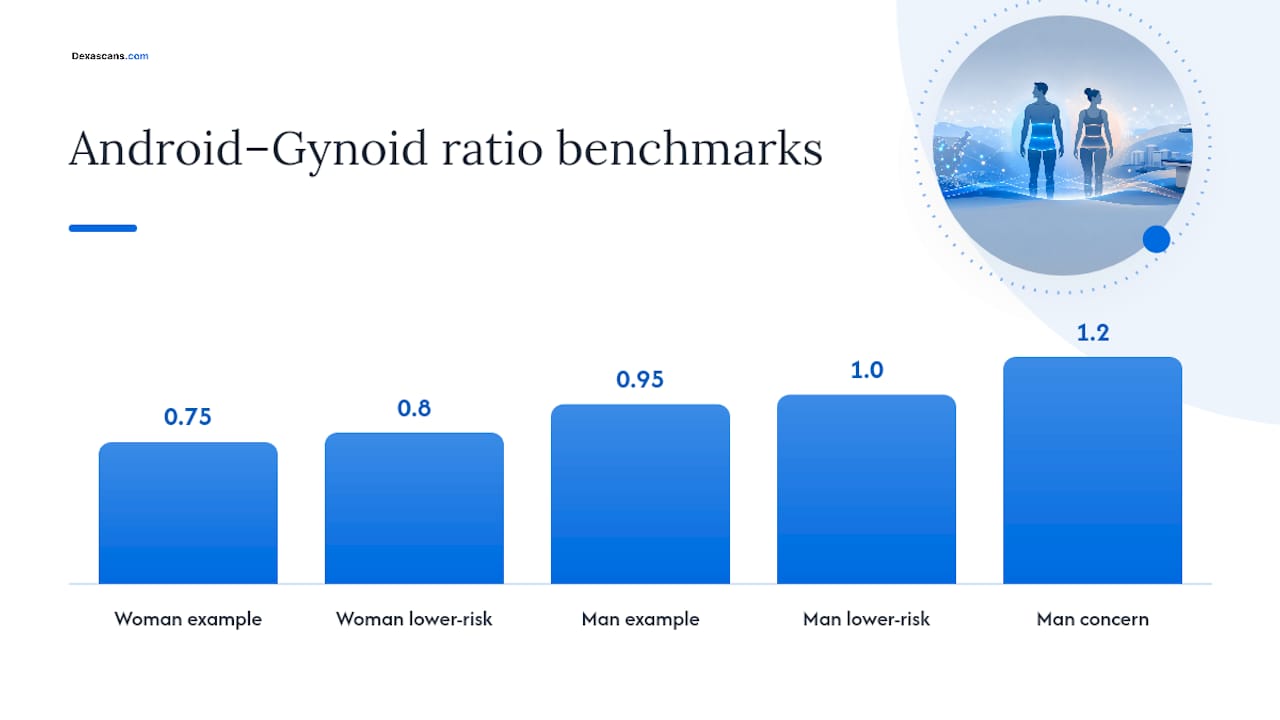
Clinicians generally treat an A/G ratio under about 0.8 in women and under about 1.0 in men as the lower-risk range, based on the thresholds referenced in DXA body composition reporting. Ratios tend to run within a general population range across individuals, with plenty of legitimate variation inside that band tied to age, sex, and genetics.
A few things to keep in mind before you treat your number like a grade on a test:
- These thresholds are population guidelines pulled from research cohorts, not a diagnostic cutoff the way an A1c or blood pressure reading works.
- Ethnic background and body frame shift where "normal" sits. A ratio that looks elevated in one population reference may be unremarkable in another.
- Lab-to-lab and machine-to-machine variance (covered above) means a ratio of 0.85 from one clinic and 0.88 from another might reflect the same underlying body, not a real change.
- A single elevated reading in isolation isn't a diagnosis. It's a flag worth discussing with a clinician alongside your labs, not a standalone verdict on your health.
Treat the number as a directional signal. If you're sitting at 0.75 as a woman or 0.95 as a man, you're in reasonably favorable territory. If you're pushing past 1.0 as a woman or 1.2 as a man, that's worth a closer look at what's driving it, especially if your labs show any accompanying changes.
The Evidence Linking a Higher A/G Ratio to Cardiometabolic Risk
This is where the android gynoid ratio earns its keep over simpler measurements. A NHANES-based analysis of normal-weight American adults found that the combination of android and gynoid fat, particularly when both regions carry elevated fat simultaneously, predicted cardiometabolic dysregulation more strongly than BMI or total body fat percentage alone. People with this "commingled" pattern showed higher odds of elevated glucose, elevated blood pressure, elevated LDL, elevated triglycerides, and low HDL. That finding matters because it applies even to people whose BMI would never flag them as high-risk. Someone can look metabolically fine on a scale and still carry a fat distribution pattern that raises real cardiovascular concern.
A ratio that predicts more than weight does. In the NHANES cohort, android and gynoid fat patterns predicted metabolic dysregulation more accurately than BMI or overall body fat percentage, a distinction that matters most for people whose weight looks unremarkable but whose fat distribution doesn't.
A separate, more recent propensity-matched study of early postmenopausal women sharpened the picture further. Women several years past menopause had a modestly higher mean A/G ratio compared to those in earlier postmenopausal years. That's a modest-looking shift on paper, but it came paired with meaningful correlations elsewhere: the A/G ratio correlated negatively with HDL cholesterol (r = −0.406), and positively with systolic blood pressure (r = 0.273), triglycerides (r = 0.367), and 10-year ASCVD risk score (r = 0.277).
Put plainly: as the ratio climbed, the "good" cholesterol dropped, blood pressure and triglycerides rose, and calculated heart disease risk edged upward. None of those correlations are enormous on their own. Together, they paint a consistent pattern across independent labs and independent cohorts.
Two caveats worth sitting with:
- Both studies are cross-sectional or matched-comparison designs, not long-term trials proving the ratio causes disease. They show association, not mechanism.
- The postmenopausal findings apply specifically to that population. A 30-year-old man's risk profile at a given A/G ratio isn't automatically the same as a 58-year-old postmenopausal woman's.
Gynoid fat itself may play a role beyond simply "not being android fat." Research on gynoid fat's protective associations suggests hip and thigh fat correlates with lower odds of several metabolic risk factors in women, hinting that lower-body fat storage isn't just neutral. It may actively buffer against some of the metabolic fallout that abdominal fat contributes to.
How Sex, Age, and Menopause Shift the Android Gynoid Ratio
Men run higher A/G ratios than women on average, largely because male fat storage defaults toward the abdomen rather than the hips. That's baseline biology, not a red flag by itself, which is exactly why the clinical thresholds differ by sex (roughly 1.0 for men versus 0.8 for women) instead of using one universal number.
Age adds another layer. A/G ratios tend to creep upward through midlife in both sexes, a slow redistribution toward central fat storage that happens even without significant weight change. For women, menopause accelerates that shift. Estrogen decline is linked to a move away from hip and thigh fat storage and toward abdominal storage, which is exactly what the postmenopausal study captured: a measurable rise in A/G ratio the further out from menopause a woman was.
A few interpretation notes worth carrying into any conversation with a clinician:
- A rising A/G ratio in a postmenopausal woman may reflect a normal hormonal transition rather than a new health problem, though it still warrants monitoring alongside labs.
- Comparing your ratio to a same-sex, similar-age reference range is far more useful than comparing it to a generic population average.
- A young man with a ratio of 1.0 and a 60-year-old postmenopausal woman with a ratio of 1.0 are not carrying the same relative risk. Context changes the number's meaning.
- Sex differences also show up in condition-specific research. A study on android and gynoid adiposity and prediabetes found android fat raised prediabetes odds in both sexes, while gynoid fat lowered those odds specifically in women.
Bringing Your A/G Ratio to a Clinician: What to Pair It With
The android gynoid ratio works best as one piece of a larger picture, not a standalone verdict. Clinicians typically want to see it alongside a short list of other measurements before drawing conclusions.
- Blood pressure, checked at rest and ideally on more than one occasion.
- Fasting lipid panel, especially HDL and triglycerides, since both correlated with A/G ratio in the postmenopausal research above.
- Fasting glucose or A1c, to catch the early insulin resistance patterns tied to central fat.
- Waist circumference, a quick cross-check against the DXA finding that costs nothing and takes ten seconds.
- Family history and personal cardiovascular risk factors, which contextualize how aggressively to act on an elevated number.
If your A/G ratio is elevated and one or more of those labs is also outside normal range, that combination is generally what prompts a clinician to recommend lifestyle changes first, with further cardiovascular workup reserved for cases where multiple risk markers stack up together.
Pro Tip: Ask your clinician whether your scan report includes a visceral adipose tissue (VAT) estimate. Many modern DXA software packages calculate VAT mass alongside the A/G ratio, and that number gives a more direct read on the metabolically active fat sitting around your organs.
Good questions to bring to that appointment: How does my A/G ratio compare to others my age and sex? Should we estimate VAT directly? What's a reasonable interval for repeat scans, six months or a year? And if my labs are borderline too, does that change your recommendation?
A/G Ratio vs. BMI, Waist–Hip Ratio, and Direct VAT Imaging
BMI measures weight relative to height and tells you nothing about where fat sits on the body. Two people with identical BMI can have completely different A/G ratios, and therefore completely different metabolic risk, which is the core limitation the NHANES research exposed. Waist-to-hip ratio gets closer to the truth using a tape measure, but it's still an external proxy. It can't distinguish subcutaneous fat sitting just under the skin from visceral fat wrapped around internal organs, and only the latter carries the stronger metabolic risk.
DXA's android and gynoid regions solve part of that problem by measuring actual tissue mass in defined anatomical zones rather than inferring shape from a tape measure. But DXA still can't fully separate subcutaneous abdominal fat from visceral fat the way CT or MRI imaging can. Some modern DXA software estimates VAT mass using algorithms trained against CT data, which narrows that gap considerably without the added radiation dose of a CT scan.
For most people, a DXA A/G ratio is enough to guide the conversation. Direct VAT imaging via CT or MRI tends to get reserved for cases where the clinical picture is ambiguous, research protocols demand precision, or a borderline A/G finding needs a more definitive answer before a major treatment decision gets made.
Lowering a High A/G Ratio: What Actually Moves the Needle
Central fat responds to the same fundamentals as fat loss anywhere else, but the mix matters more here than the scale number.
- Cut refined carbohydrates and added sugar before cutting calories broadly. Diets that reduce insulin spikes tend to preferentially shrink visceral and android fat faster than uniform calorie restriction alone.
- Add resistance training two to three times a week. Building lean mass changes the fat-to-muscle ratio inside the android region and improves how the body handles glucose.
- Layer in cardiovascular activity, particularly higher-intensity intervals, which several studies tie specifically to visceral fat reduction beyond what steady-state cardio achieves alone.
- Prioritize sleep and stress management. Cortisol elevation from chronic stress and poor sleep is one of the more underappreciated drivers of abdominal fat storage.
Give it three to six months before expecting a measurable shift on a repeat scan. Waist circumference can serve as a cheap interim check between DXA appointments.
Pro Tip: Combining resistance training with diet changes tends to improve fat distribution more than diet alone, even when total weight loss looks similar on the scale, because muscle gain in the android region changes the composition math, not just the number on it.
Getting an Accurate Scan: Precision, Radiation, and What to Check Before Booking
DXA body fat measurements carry a precision of roughly ±1 to 2% when the machine is properly calibrated and the technician follows standard positioning protocol. That's tight enough to catch real trend changes over months, but it also means small single-scan fluctuations shouldn't cause alarm on their own.
Radiation exposure is minimal. A DXA scan delivers a dose well below a standard chest X-ray, and the EPA's guidance on medical X-ray exposure puts diagnostic imaging like this firmly in the low-risk category for routine use.
Before booking, a few things worth confirming with the clinic:
- Ask whether the scan is full-body composition, not a limited regional scan, since the A/G ratio requires both android and gynoid regions to be captured.
- Note the machine brand (GE Lunar or Hologic are the two most common), especially if you plan to repeat the scan later for trend tracking.
- Confirm the technician's training and how often the machine gets calibrated.
- Check that pricing is transparent upfront rather than bundled into a vague consultation fee.
Dexascans verifies scan types and pricing across its listed clinics, which removes some of the guesswork from that checklist.
Why We Publish A/G Ratio Guides
Reading a DXA report shouldn't require a medical degree, and it shouldn't feel like decoding a foreign language either. Dexascans exists partly to help people find verified scan locations, but explaining what the numbers on that printout actually mean matters just as much as finding a place to get scanned.
An A/G ratio is genuinely useful information. It's also incomplete on its own. The strongest use of this number pairs it with your bloodwork and a clinician who can weigh it against your age, sex, and personal history, not a chart you found online that tells you whether to worry.
— Erik
Compare Clinics, Machines, and Prices Before You Book
Not every DXA scan gives you the full picture. A limited regional scan won't calculate an android gynoid ratio at all, and pricing between clinics can vary by a wide margin for the exact same test. Dexascans lists over 500 verified locations across 48 states specifically so you can compare full-body composition scans against limited ones, check which machine brand a clinic runs, and see cash pricing upfront instead of getting quoted a number after you've already shown up.
That transparency matters more for this particular metric than for most. If you're tracking your A/G ratio over time, sticking with the same machine brand and confirming the scan includes both android and gynoid regions saves you from comparing numbers that were never apples to apples in the first place. Search verified DXA locations near you to compare full-body composition options, confirm machine brand, and book a scan with pricing you can see before you commit.
This article is general information, not a substitute for advice from a qualified doctor. Consult a qualified healthcare professional about your own circumstances before acting on anything here.
Sources
- DXA body composition analysis | Sports Medicine | UC Davis Health
- Commingling effect of gynoid and android fat patterns on cardiometabolic dysregulation in normal weight American adults
- DXA Android-to-Gynoid Ratio and Cardiovascular Risk Assessment in Age and BMI Propensity-Matched Early Postmenopausal Women
FAQ
What Is a Good Android to Gynoid Ratio?
A ratio under about 0.8 is generally considered lower-risk for women, and under about 1.0 for men, based on thresholds used in DXA reporting. These are population guidelines rather than fixed diagnostic cutoffs, so context like age and menopausal status still matters.
Is 20% Body Fat Skinny?
Twenty percent body fat sits in the athletic-to-fit range for most men and the lean-to-average range for most women, though healthy ranges shift with age and sex. Total body fat percentage alone doesn't reveal fat distribution, which is exactly why the android gynoid ratio adds a layer BMI and overall body fat percentage can't provide.
Is Gynoid Fat Hard to Lose?
Gynoid fat, stored in the hips and thighs, tends to respond more slowly to diet and exercise than abdominal fat in many people, partly due to hormonal influences on lower-body fat storage. It's also worth remembering that some gynoid fat carries a protective metabolic association, so the goal for most people is reducing android fat rather than eliminating gynoid fat entirely.
Is 38% Muscle Mass Good for a Woman?
A DXA scan showing lean mass alongside your android gynoid ratio gives a fuller picture than either number alone, and comparing results against your own baseline over time matters more than chasing a single benchmark figure.